Why RCA Software?
In quality-critical industries such as manufacturing, automotive, pharmaceuticals, medical technology, and food production, the requirements for root cause analysis software are particularly high. Without systematic analysis, many corrective measures remain superficial – errors are often treated only symptomatically and their causes are not properly identified – resulting in recurring errors.
Communication via email and presentation in spreadsheets makes it difficult to find the actual causes and is also difficult to trace.
With RCA Software, you can ensure that both analyses and measures are documented in a traceable and audit-proof manner at all times. Central data storage enables the monitoring of all defined measures and bundles the stored information at the relevant points. This allows the responsible teams to deal with problems much more quickly, and the software provides information quickly and confidently in audits or customer inquiries. Repetitive errors can be prevented in the long term by automatic warnings to ensure the continuous improvement process.
Root Cause Analysis with CAQ.Net
CAQ.Net helps you get to the root causes of problems and uncover potential for improvement. Using Ishikawa and 5-Why, the RCA Software provides you with powerful tools for cause-and-effect research.
 5-Why method in REM.Net
The 5-Why Method
With the 5-Why method in the Complaint Management Software REM.Net, you can identify the real causes of problems by asking specific questions. The analysis is carried out in a structured manner within the deviation processing in the REM.Net module:
- You successively add “Why?” questions to each type of cause (e.g., person, method, material).
- You can select these causes from predefined libraries or add them individually.
- The last answer in the chain of questions is then converted directly into measures as the main cause.
Advantages:
- Consistent analysis process in the system
-
Use of templates for recurring causes
-
Recordable and documentable standard report
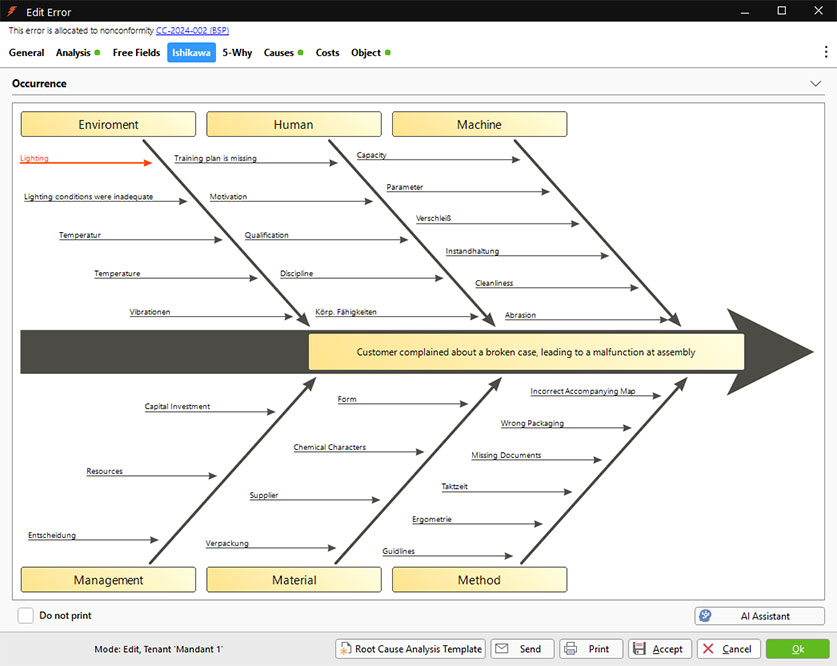 Ishikawa Diagram in REM.Net
The Ishikawa Diagram
The Ishikawa Diagram, also known as a fishbone diagram, supports you in REM.Net with the graphical root cause analysis of complex problems. It helps to systematically display all factors influencing an error and to reveal correlations.
- In the “Ishikawa” tab, possible causes are collected in a structured manner according to cause types (e.g., human, method, material, machine).
-
These so-called 4M categories can be expanded to up to 8M (e.g., management, environment, measurement, money).
- The associated causes of errors are entered within each type of cause.
-
The causes can be filled in using a template or with the support of the integrated AI assistant.
Advantages:
- Ideal for teamwork and root cause analysis
-
Supports fact-based identification of measures
- Can be recorded and documented with the standard report root cause analysis (Ishikawa)
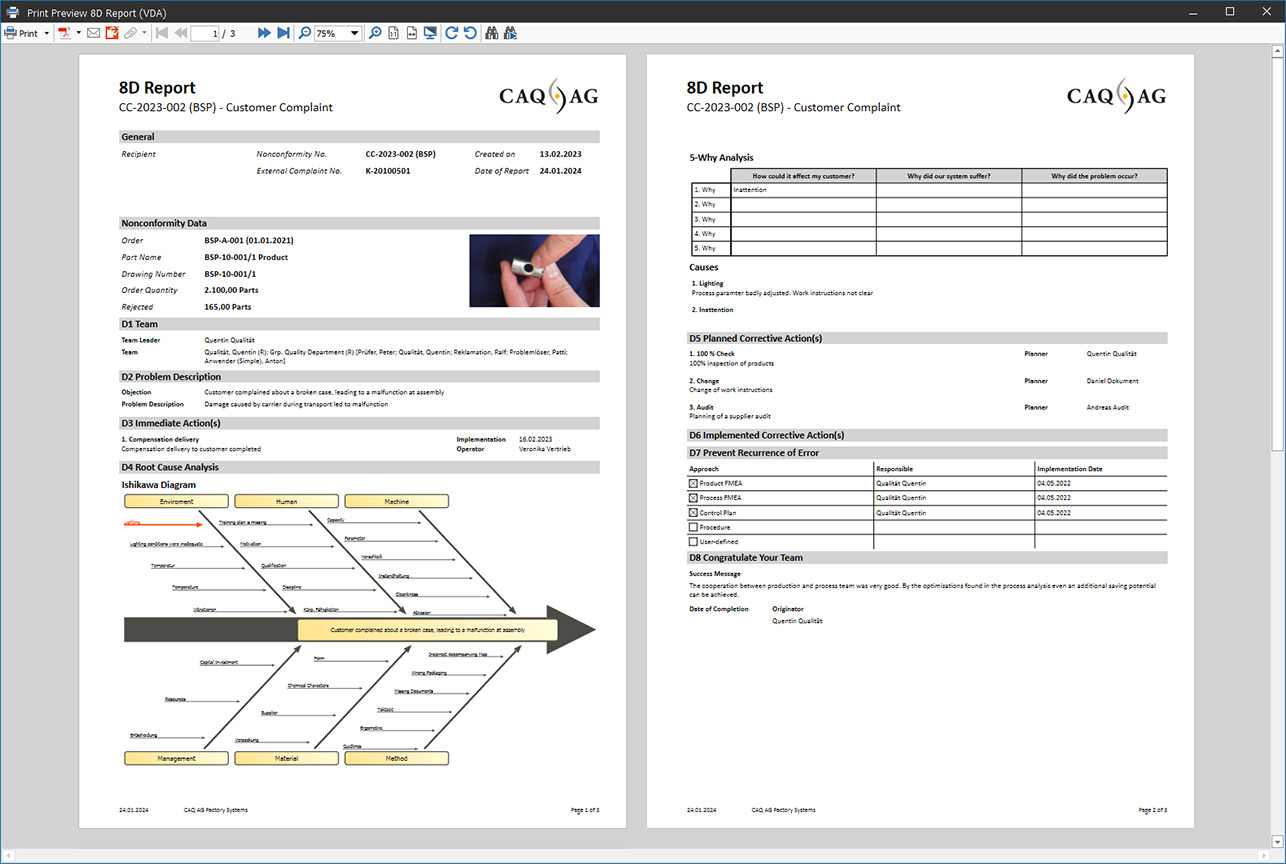 8D Report in REM.Net
The Entire Process as an 8D report
The 8D report is a complete problem-solving process with eight defined steps (D1–D8). It describes the entire process from problem description and root cause analysis to sustainable error prevention.
The 8D Report Software REM.Net guides you through the entire 8D process and ensures that no details are overlooked. The assistant-guided recording and processing of your complaint data enables you to communicate with suppliers in a clearly structured and effective manner. In addition to 8D, you can also use other freely definable methods or deviation types in REM.Net and assign individual documents to them.
The eight “Ds” (from ‘Disciplines’) represent the individual process steps used to process a complaint. The eight “Ds” include:
- D1: Assembling a team for problem solving
-
D2: Preparing a clear description of the problem
-
D3: Determining immediate measures
- D4: Identifying the cause of the error
-
D5: Planning corrective measures
- D6: Introducing corrective measures
-
D7: Preventing errors from recurring
-
D8: Recognizing the teams performance and completing the 8D process